Features
Metripy provides comprehensive code analysis capabilities across multiple languages and projects.
📊 Code Analysis
Supported Metrics
Cyclomatic Complexity
Measures the number of linearly independent paths through the code. Lower is better.
- Good: ≤ 5
- OK: 6-10
- Warning: 11-20
- Critical: > 20
Maintainability Index
A composite metric that indicates how maintainable the code is. Higher is better.
- Excellent: ≥ 80
- Good: 65-79
- Fair: 50-64
- Poor: < 50
Lines of Code (LOC)
Physical lines of code, excluding comments and blank lines.
- Small: < 50
- Medium: 50-200
- Large: 201-500
- Very Large: > 500
Method Size
Average lines of code per function/method.
- Concise: < 10
- Optimal: 10-25
- Long: 26-50
- Too Long: > 50
Halstead Metrics
- Volume
- Difficulty
- Effort
- Time to understand
- Bugs estimate
Supported Languages
| Language | Status | Engine | Features |
|---|---|---|---|
| Python | ✅ Stable | radon | Full support with all metrics |
| PHP | 🧪 Experimental | lizard + custom AST | Basic metrics |
| TypeScript | 🧪 Experimental | tree-sitter | Basic metrics |
More coming soon…
🔍 Git Analysis
Analyze your repository’s history to gain insights into code evolution and team dynamics.
Git Metrics
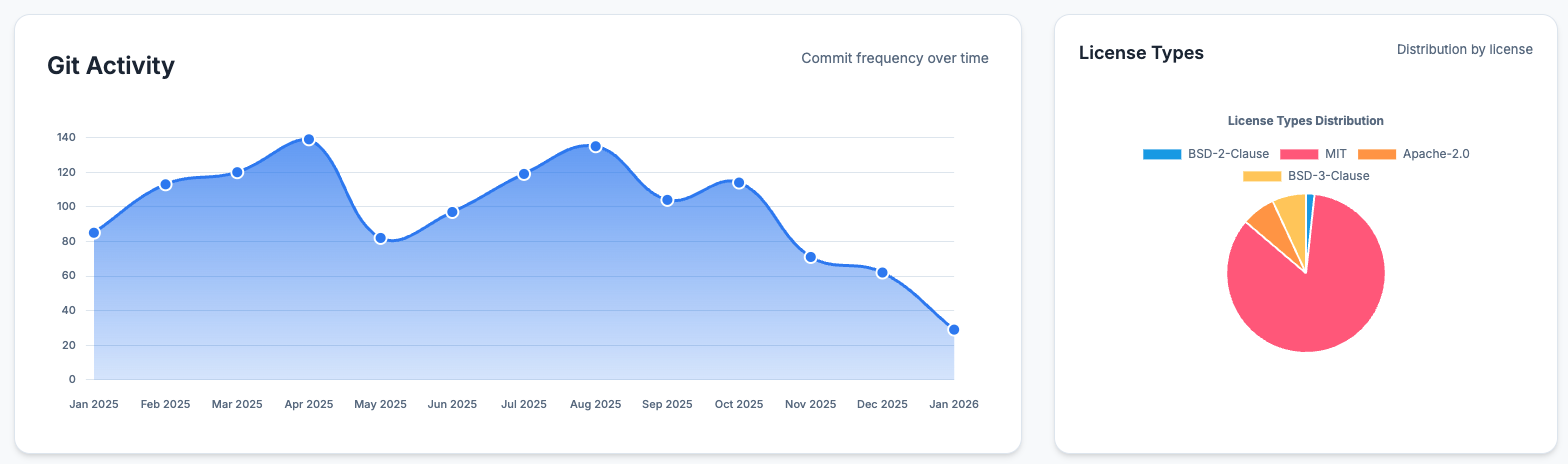
- Commits over time: Visualize commit frequency
- Active contributors: Identify key contributors
- Code churn: Track files with frequent changes
- Hotspots: Find files with high complexity AND high change frequency
- Knowledge silos: Identify files maintained by single contributors
- Commit patterns: Analyze when code is being written
Knowledge Distribution
Understand how knowledge is distributed across your team:
- Files with single contributors (high risk)
- Shared ownership metrics
- Contributor expertise mapping
Code Hotspots
Identify files that need attention based on:
- High complexity
- Frequent changes
- Recent modifications
- Multiple contributors
📦 Dependency Analysis
Track and analyze your project dependencies.
Supported Package Managers
| Package Manager | Language | File |
|---|---|---|
| pip | Python | requirements.txt, pyproject.toml |
| npm | JavaScript/TypeScript | package.json |
| Composer | PHP | composer.json |
More coming soon…
Dependency Insights
- Version status: Latest vs. required version
- GitHub stars: Popularity indicator
- Monthly downloads: Usage statistics
- License types: Legal compliance tracking
- Outdated packages: Identify packages needing updates
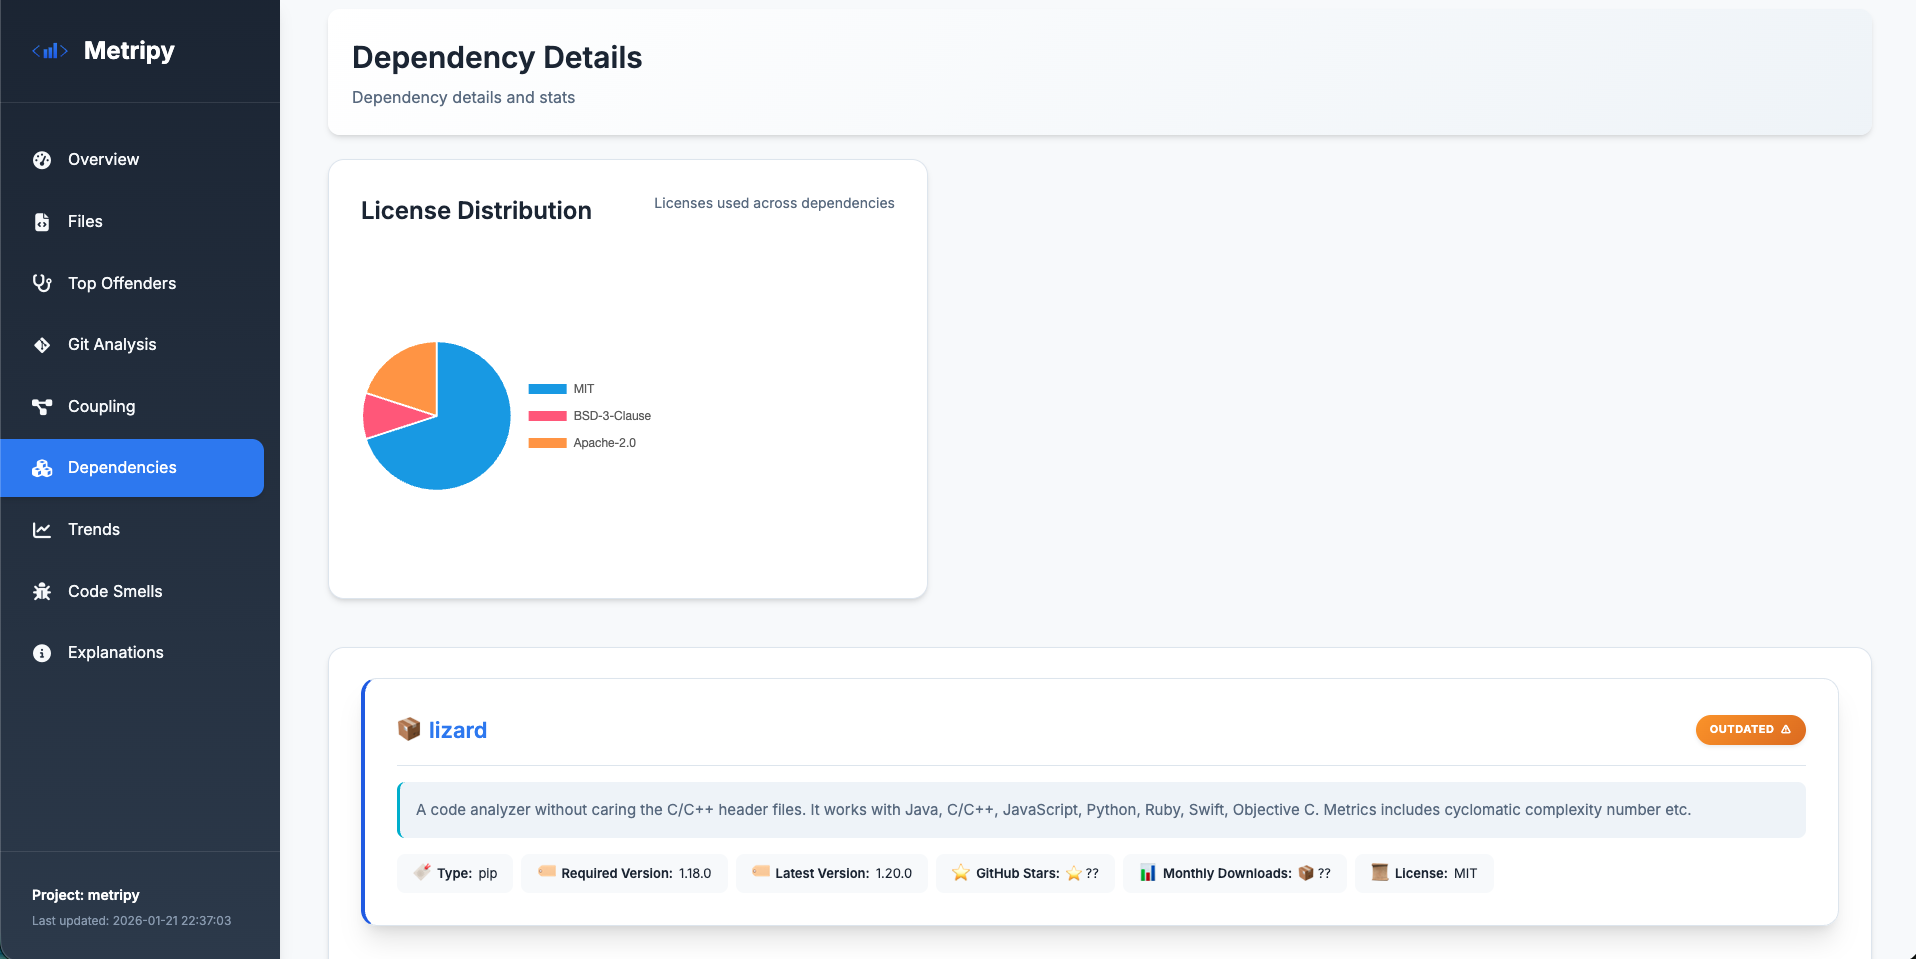
License Distribution
Visualize the distribution of licenses in your dependencies:
- MIT, Apache, GPL, BSD, etc.
- Custom licenses
- Proprietary licenses
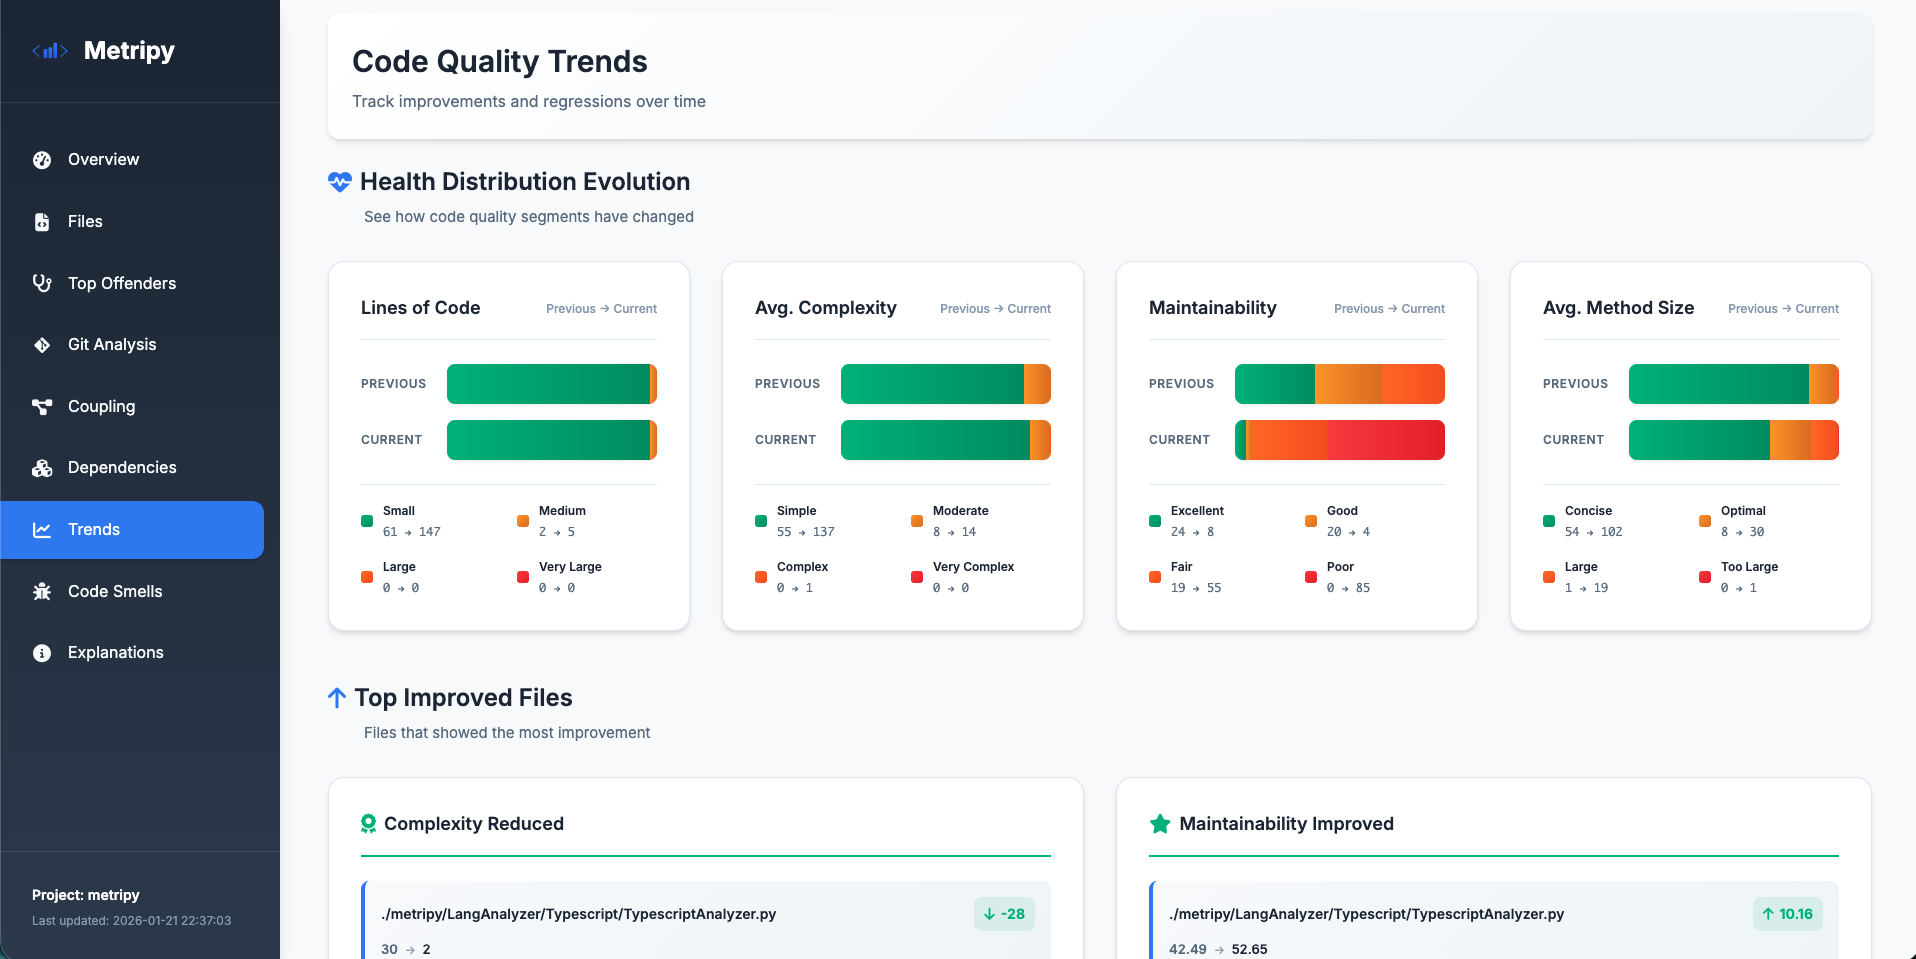
📈 Trend Analysis
Track how your codebase evolves over time.
Historical Tracking
- Store analysis results in JSON format
- Compare current state with previous analyses
- Track delta values for all metrics
Trend Visualizations
Health Distribution Evolution
See how files move between health categories:
- Good → OK → Warning → Critical
- Track improvements and regressions
- Segment-by-segment comparison
Top Improved Files
Celebrate wins:
- Complexity reductions
- Maintainability improvements
- Code size optimizations
Files Needing Attention
Focus your efforts:
- Increased complexity
- Decreased maintainability
- Growing file sizes
Trend Badges
Visual indicators on the dashboard:
- 📈 Trending up (worse)
- 📉 Trending down (better)
- ➡️ Stable
- Delta values for context
🎨 Report Formats
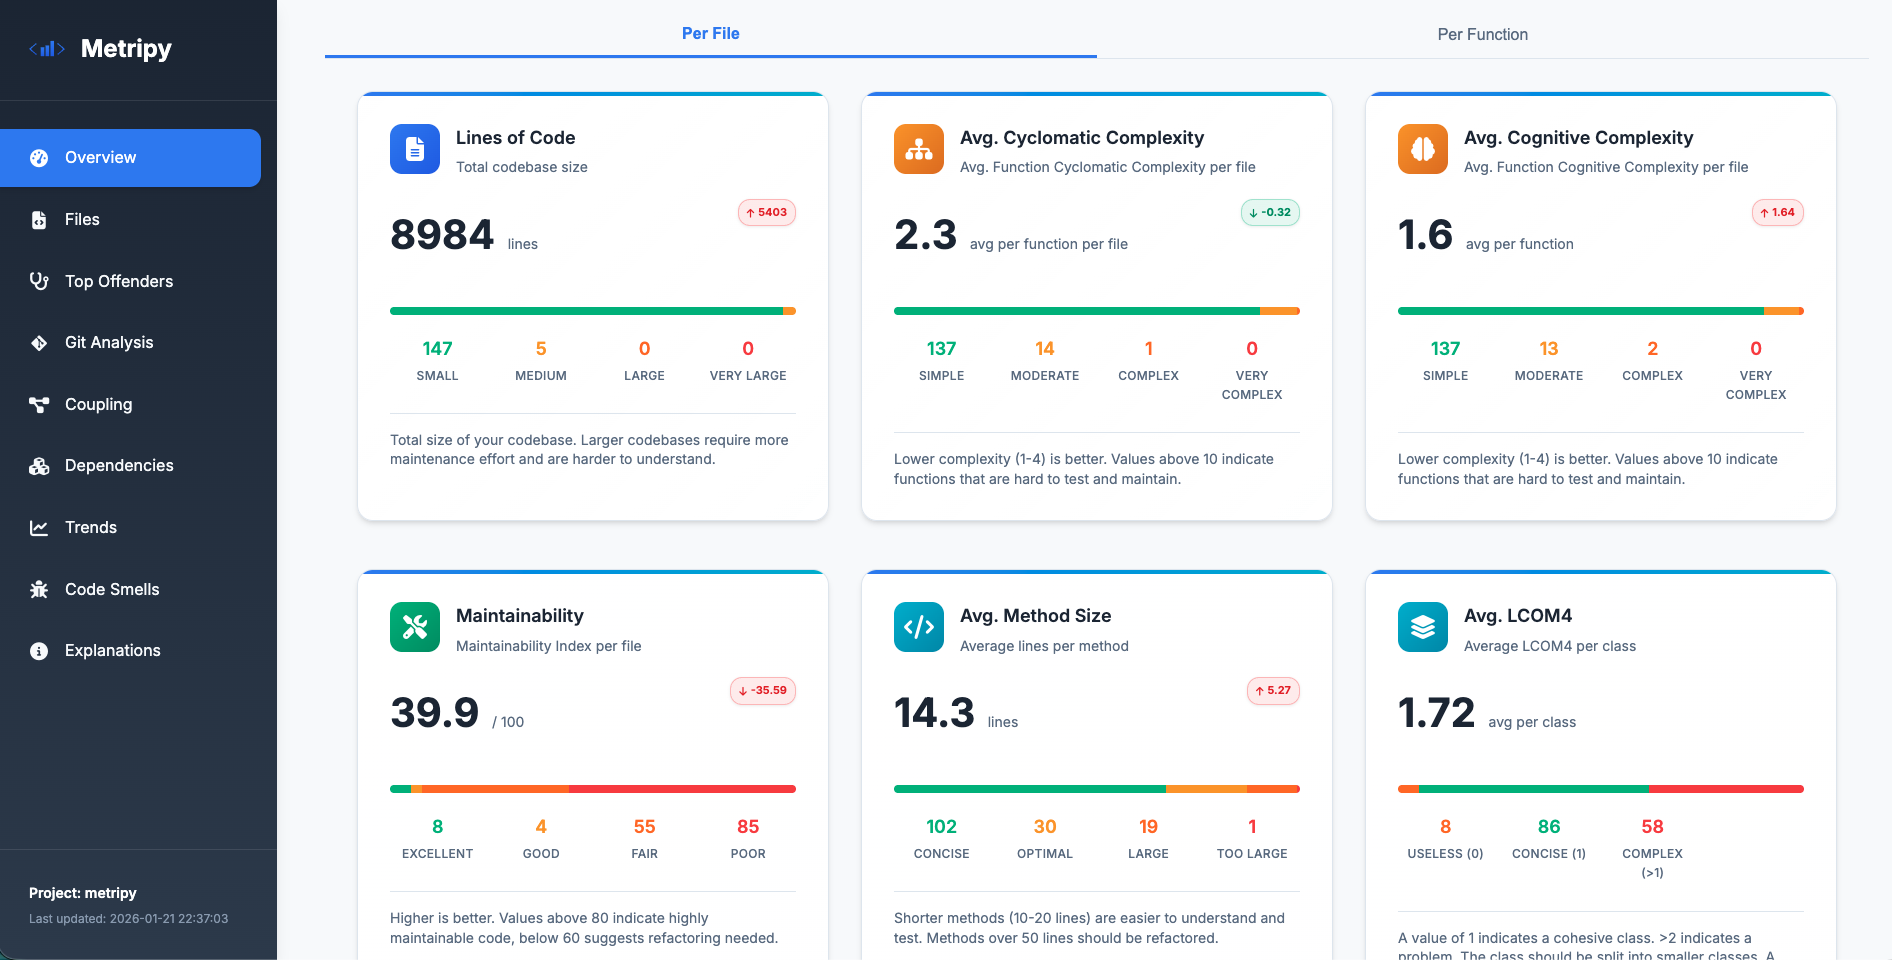
HTML Dashboard
Interactive, beautiful reports with:
Overview Page
- Total lines of code
- Average complexity
- Maintainability index
- Method size distribution
- License distribution
- Trend indicators
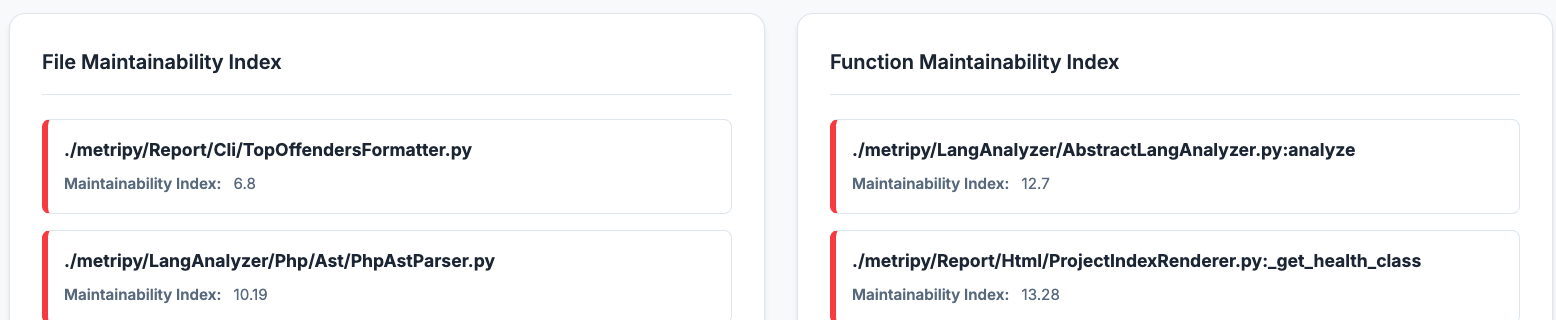
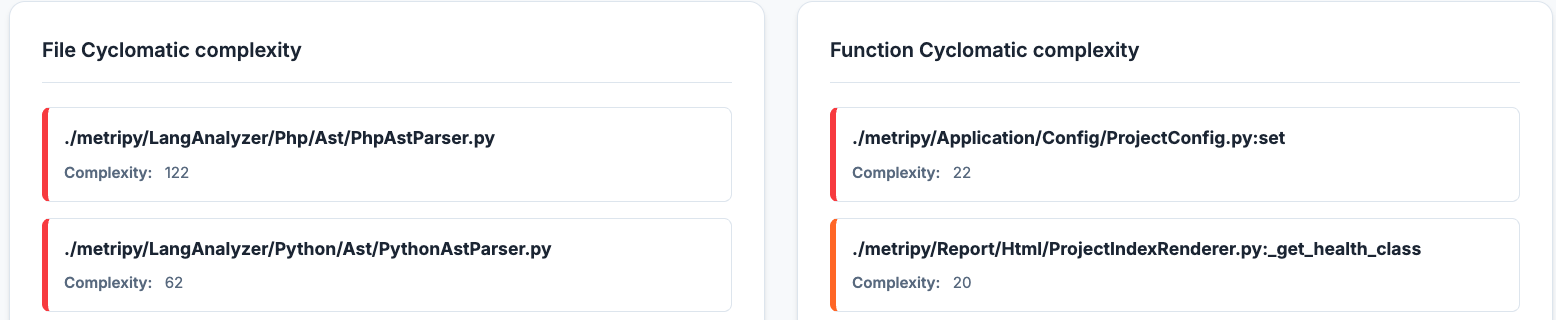
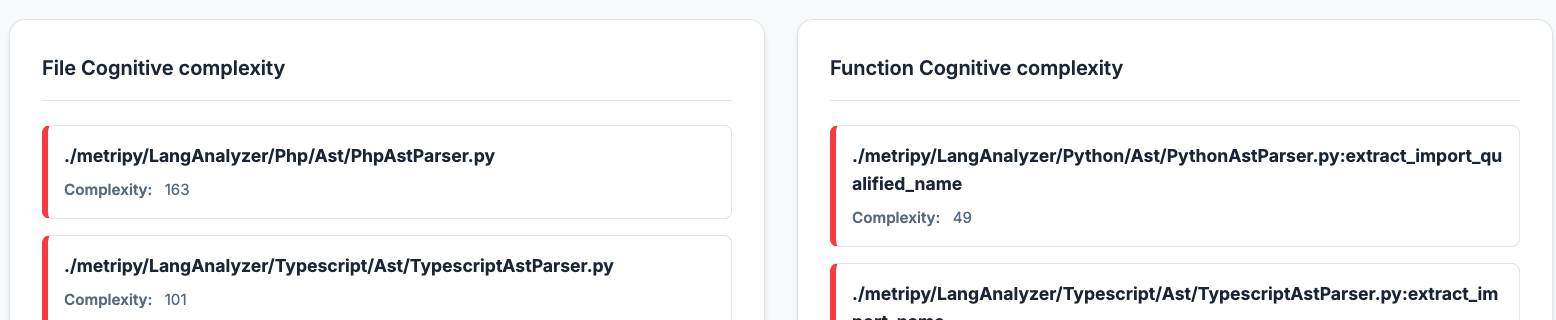
Top Offenders
Quickly identify problematic areas in your codebase:
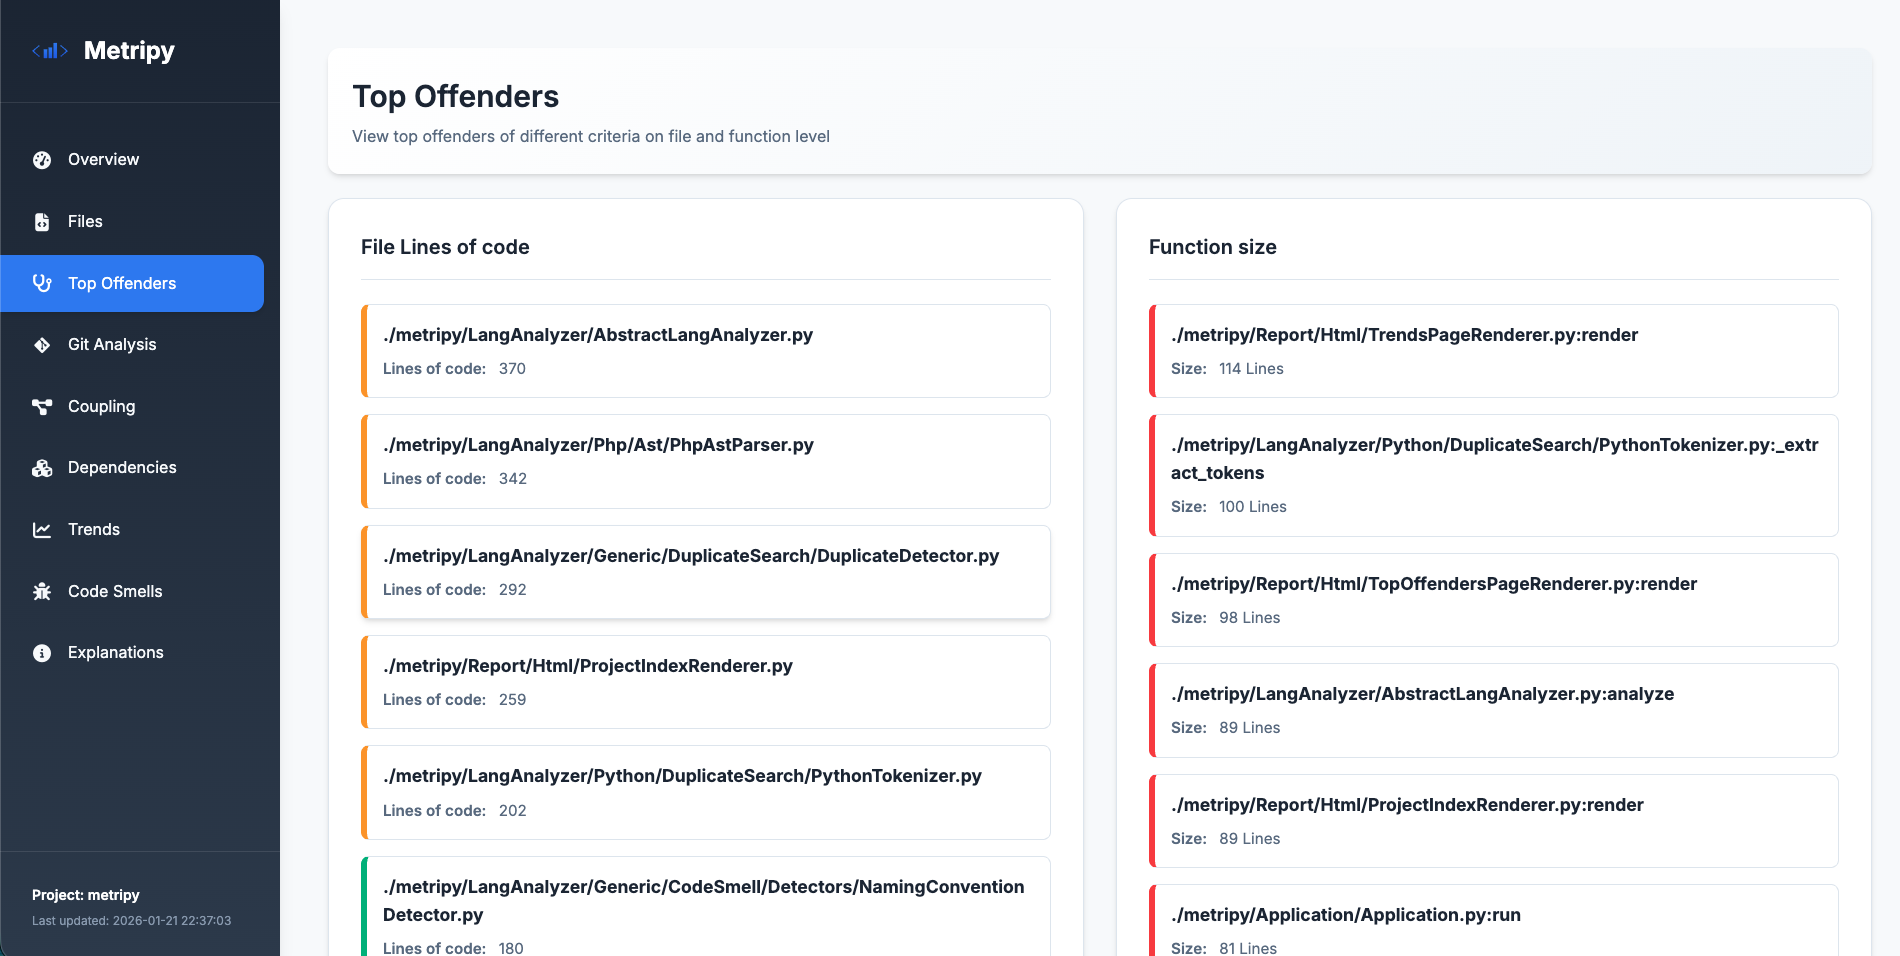
Drill down into specific metrics:
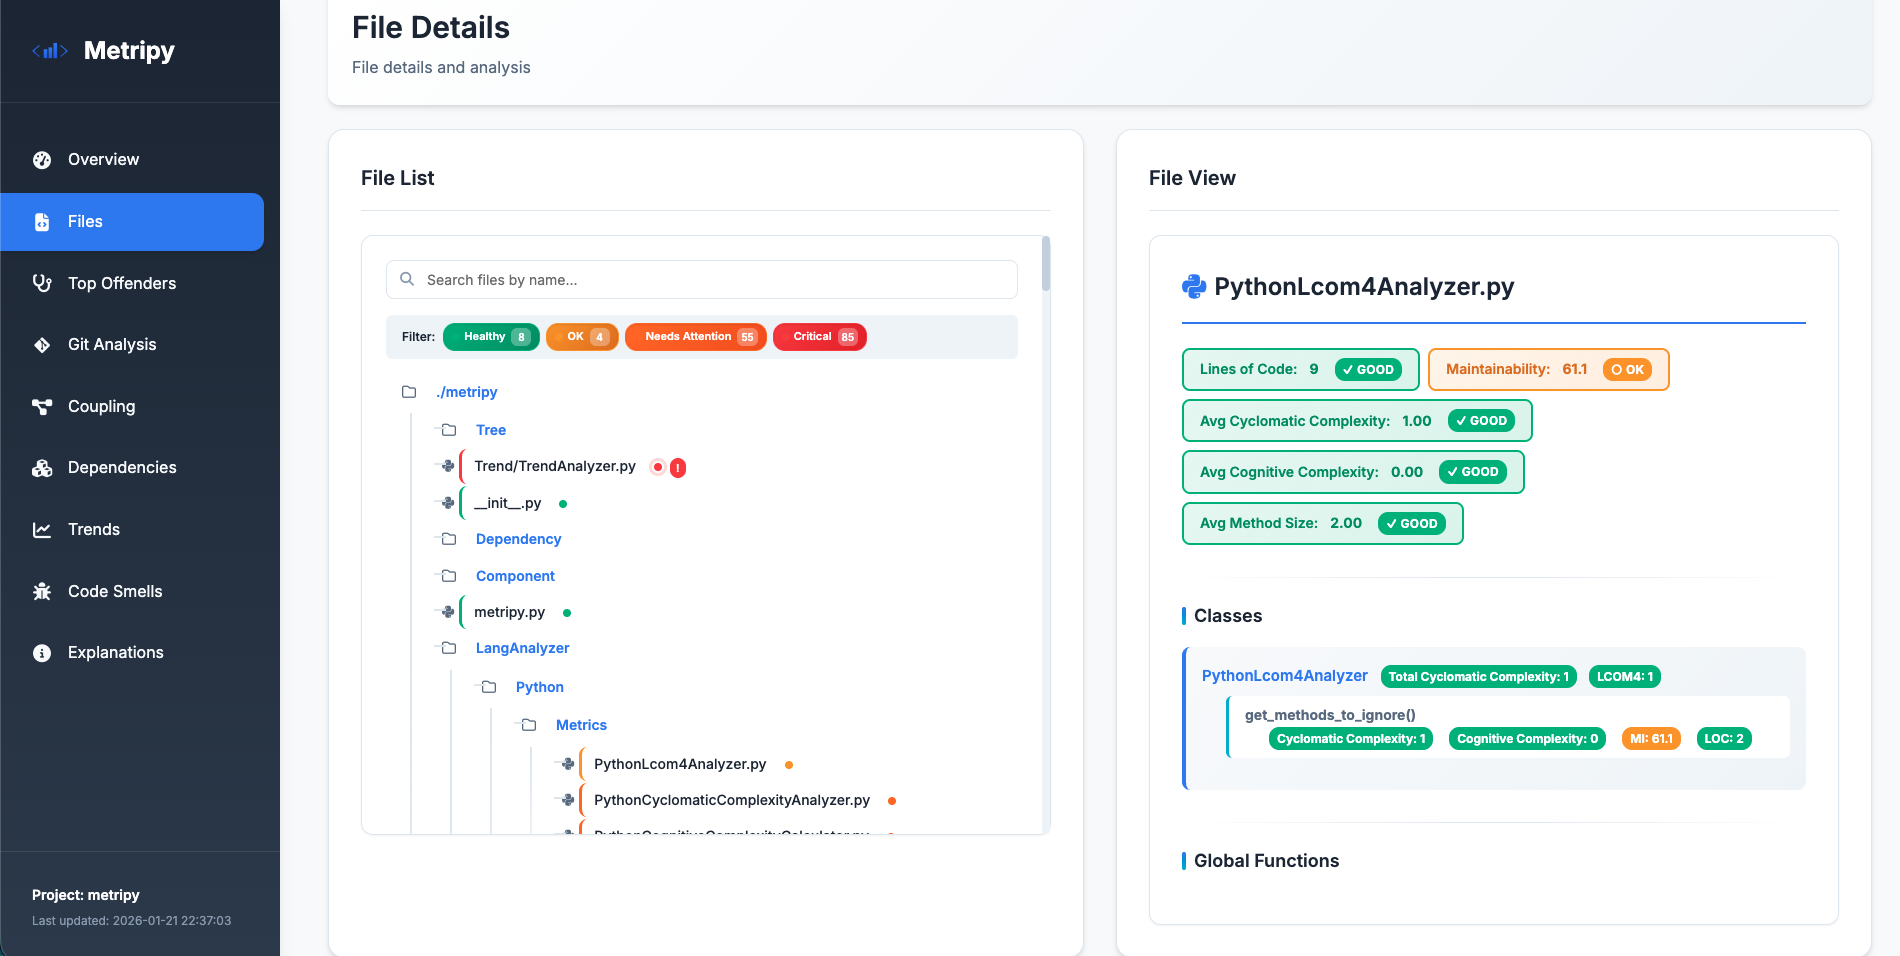
Files Page
- File tree with health indicators
- Filterable by health status
- Detailed file metrics
- Class and function breakdown
- Color-coded complexity
Git Analysis Page
- Contributor statistics
- Commit timeline
- Code hotspots
- Knowledge distribution
- Churn analysis
Dependencies Page
- Package list with status
- Version information
- License distribution
- GitHub metrics
Trends Page
- Health distribution evolution
- Top improved files
- Files needing attention
- Historical comparisons
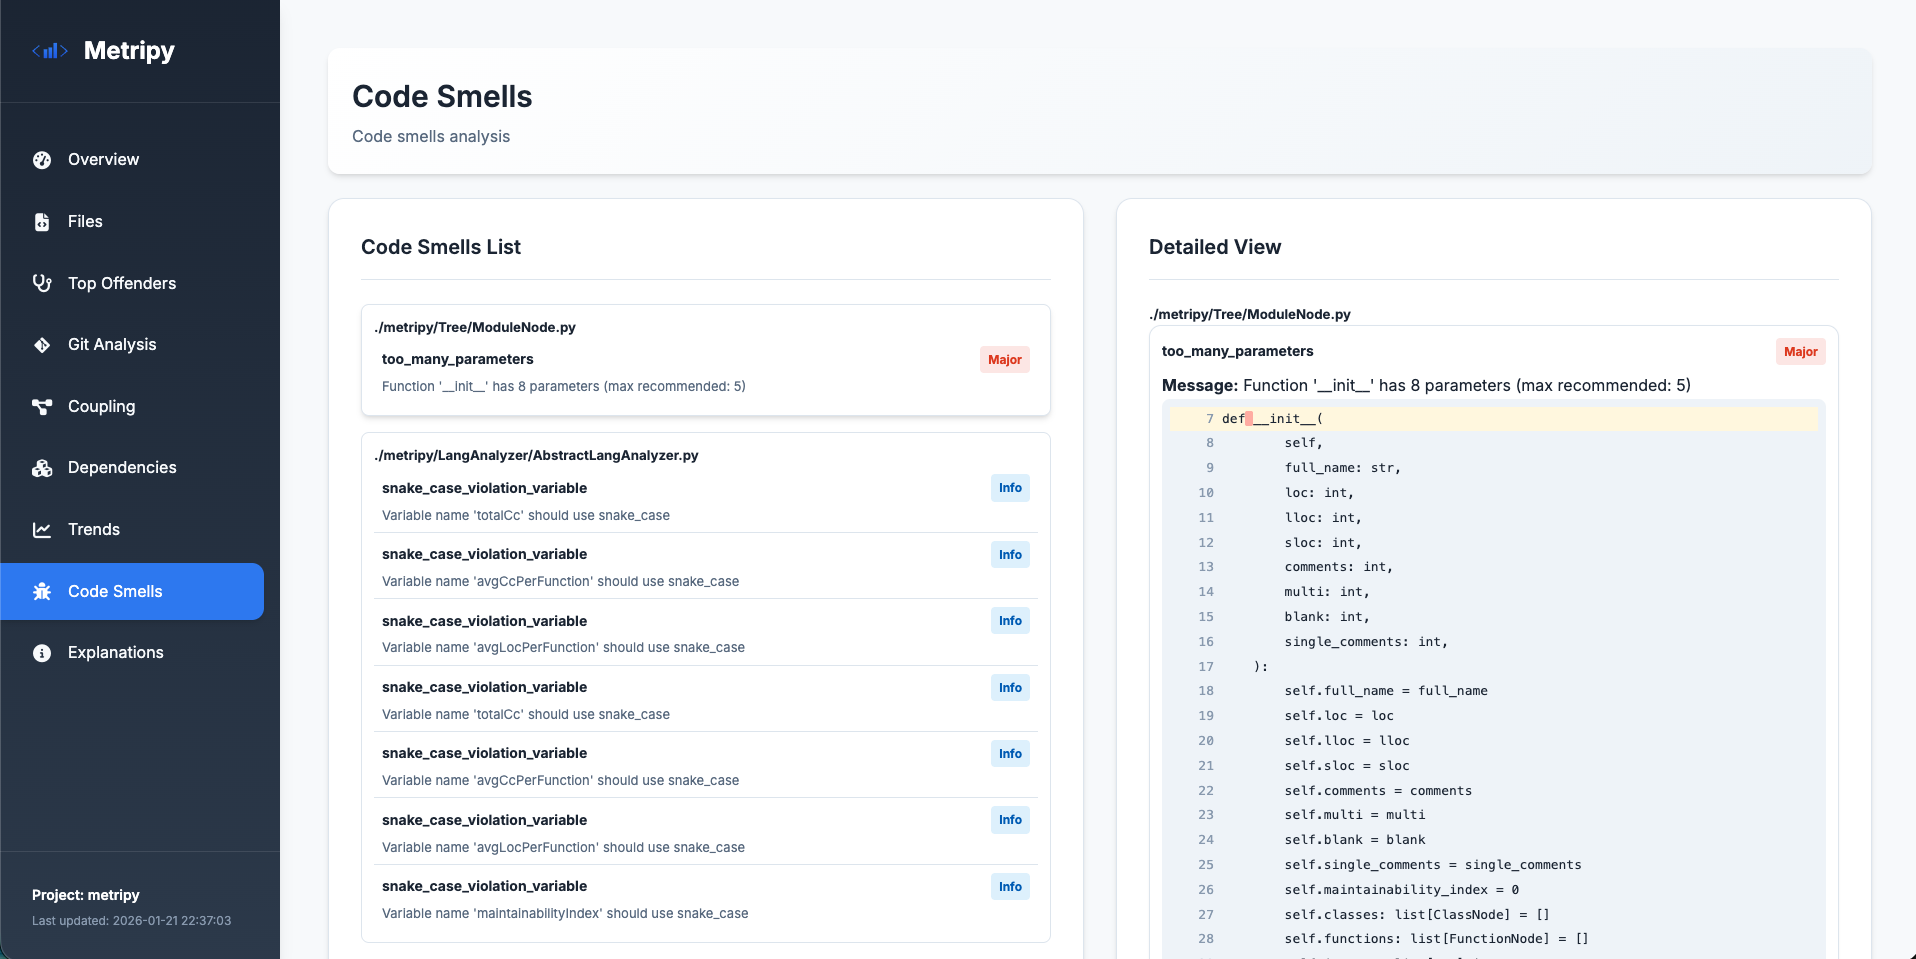
Code Smells Page
- Detected code smell patterns
- Severity classification
- File and location details
CLI Report
Print a comprehensive overview directly to the terminal with color-coded visualizations:
"reports": {
    "cli": "."
}
Sections included:
| Section | Description |
|---|---|
| Overview | Aggregated metrics with stacked bar charts for LOC, complexity, maintainability, method size, and LCOM4 |
| Top Offenders | Side-by-side tables showing the worst files and functions for each metric |
| Coupling Metrics | Module count, dependencies, max coupling, and instability distribution |
| Code Smells | Summary of detected code smells by severity (info, minor, major, critical) |
| Git Metrics | Contributor stats and activity (if git analysis enabled) |
| Dependencies | Package status overview (if dependency analysis enabled) |
The CLI report uses ANSI colors for visual indicators:
- 🟢 Green: Good/Excellent
- 🟡 Yellow: OK/Moderate
- 🟠 Orange: Warning
- 🔴 Red: Critical
JSON Export
Export analysis results as JSON for:
- Custom integrations
- Historical tracking
- CI/CD pipelines
- Custom dashboards
Formats:
json: Full analysis resultsjson-git: Git-only analysis
CSV Export
Export metrics in CSV format for spreadsheet analysis and custom reporting.
GitLab Code Quality Report
Generate reports compatible with GitLab’s Code Quality feature:
"reports": {
    "gl-codequality-report": "./build/gl-codequality.json"
}
This creates a JSON report that GitLab can display in merge request diffs, highlighting code quality issues directly in the changed files.
🚦 Quality Gates (Failure Conditions)
Enforce code quality standards by defining failure conditions that cause the analysis to exit with specific exit codes when thresholds are exceeded.
How It Works
- Define thresholds for code metrics at file, class, or function level
- Specify severity levels to monitor (
good,ok,warning,critical) - Set the maximum allowed count before failure
- Assign exit codes for different failure conditions
Supported Metrics
| Level | Metrics |
|---|---|
| File | file_loc, file_cyclomatic_complexity, file_maintainability_index, file_cognitive_complexity |
| Class | class_loc, class_cyclomatic_complexity, class_lcom4 |
| Function | function_loc, function_cyclomatic_complexity, function_maintainability_index, function_cognitive_complexity |
Example Configuration
{
    "failure": {
        "1": [
            {
                "value": "function_cyclomatic_complexity",
                "severity": "critical",
                "amount": 5
            }
        ]
    }
}
This exits with code 1 if there are 5 or more functions with critical cyclomatic complexity.
CI/CD Benefits
- Break the build when code quality degrades
- Different exit codes for different severity levels
- Clear error messages identifying which conditions failed
- GitLab Code Quality report integration
See Configuration Guide for detailed setup instructions.
🔧 Advanced Features
Multi-Project Analysis
Analyze multiple projects in a single run:
- Shared configuration file
- Parallel processing
- Consolidated or separate reports
- Cross-project comparisons
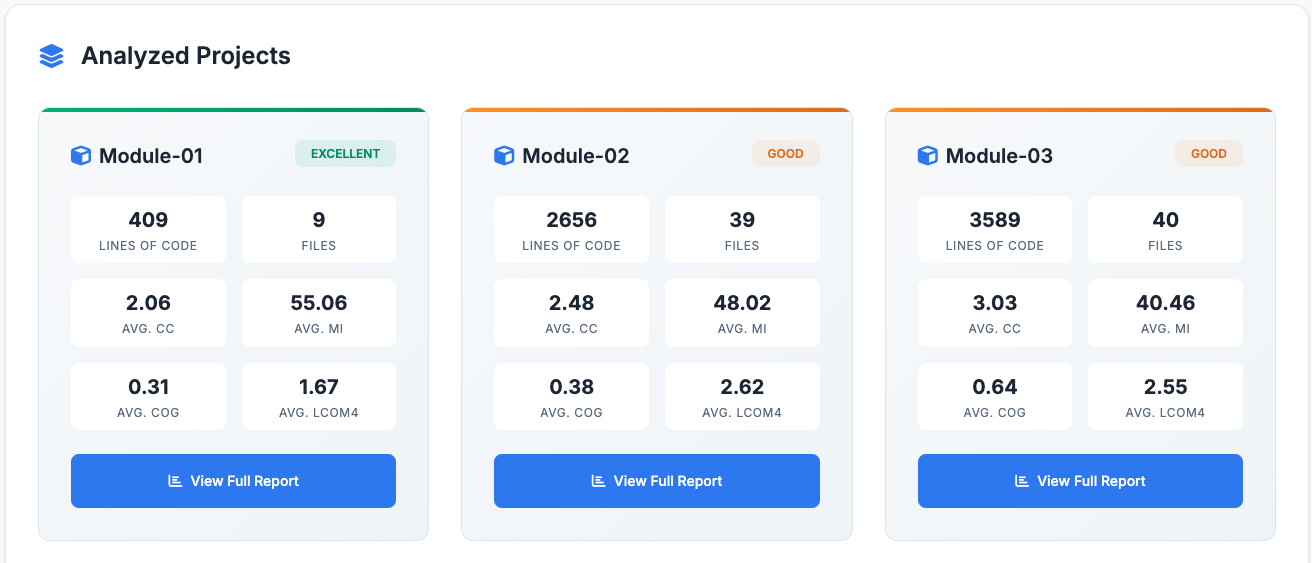
HTML Project Index
Generate a central overview page for all your projects:
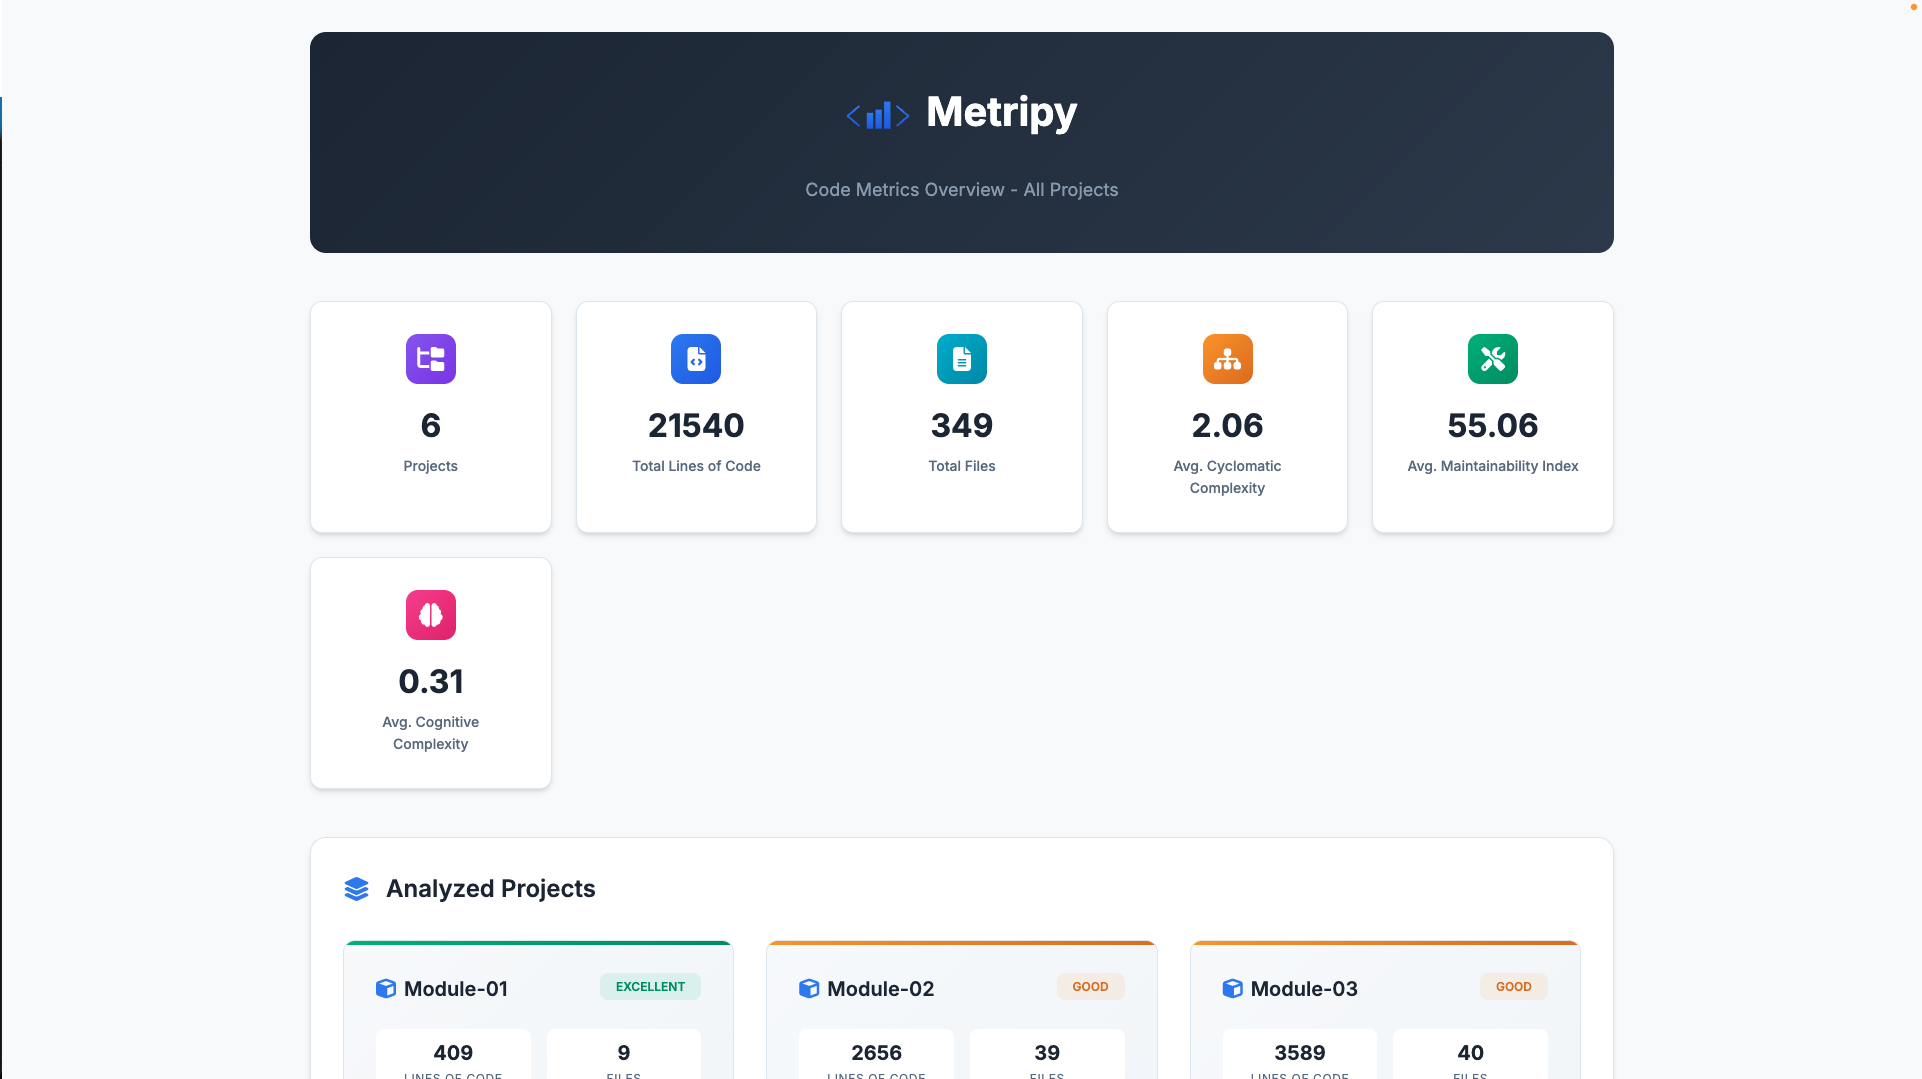
The index page displays:
- Aggregate statistics across all projects
- Project cards with individual metrics and health badges
- Quick navigation to detailed reports
Configure with:
{
    "configs": { /* your projects */ },
    "html_index": "./build/index.html"
}
Flexible Configuration
- JSON configuration files
- Command-line arguments
- Per-project settings
- Include/exclude patterns
- Custom file extensions
File Filtering
Control what gets analyzed:
- Include paths
- Exclude patterns
- File extensions
- Hidden files
- Test files
Custom Report Paths
Output reports wherever you need:
- Custom HTML paths
- JSON export locations
- Multiple report formats per project
🔒 Privacy & Security
- All analysis happens locally
- No data sent to external services
- Dependency info fetched from public APIs only
🎯 Use Cases
For Developers
- Understand code complexity before refactoring
- Track personal code quality improvements
- Identify technical debt hotspots
For Teams
- Monitor codebase health trends
- Identify knowledge silos
- Track team productivity
- Code review prioritization
For Managers
- Report on code quality metrics
- Track technical debt over time
- Resource allocation insights
- Release readiness assessment
For CI/CD
- Automated quality gates with configurable failure conditions
- Fail builds on threshold violations
- Custom exit codes for different severity levels
- Trend tracking in pipelines
- Quality metrics for PRs (coming soon)
Coming Soon
- ⏳ More language support
- ⏳ More report formats
- ⏳ HTML report inter project comparisons
- ⏳ Docker image
- ⏳ Quality metrics for PRs
- And more