Configuration
Metripy uses JSON configuration files to specify analysis settings. You can configure multiple projects in a single file.
Quick Configuration
Create a minimal metripy.json file:
{
    "configs": {
        "my-project": {
            "base_path": "./",
            "includes": ["src/"],
            "extensions": ["py"],
            "reports": {
                "html": "./build/report"
            }
        }
    }
}
Run with:
metripy --config=metripy.json
Configuration Structure
Root Object
{
    "configs": {
        "project-name-1": { /* project config */ },
        "project-name-2": { /* project config */ }
    },
    "html_index": "./build/index.html"
}
The configs object contains named project configurations. Each key is a project name.
The optional html_index generates a central overview page linking to all project reports.
Project Configuration
Basic Settings
base_path (required)
Base directory to analyze.
"base_path": "./"
Can be relative to the config file or absolute:
"base_path": "/absolute/path/to/project"
includes (optional)
Array of paths to include, relative to base_path.
"includes": [
    "src/",
    "lib/"
]
If not specified, all files matching extensions are included.
excludes (optional)
Array of patterns to exclude.
"excludes": [
    "__pycache__",
    "node_modules",
    "*.test.py",
    "build/",
    ".venv"
]
extensions (required)
Array of file extensions to analyze (without dots).
"extensions": ["py"]
Multiple extensions:
"extensions": ["py", "pyw"]
Git Analysis
Enable Git history analysis:
"git": {
    "branch": "main"
}
Options:
branch: Git branch to analyze (default:main)
To disable git analysis, omit the git key.
Dependency Analysis
Python (pip)
Analyzes requirements.txt or pyproject.toml:
"pip": true
JavaScript/TypeScript (npm)
Analyzes package.json:
"npm": true
PHP (Composer)
Analyzes composer.json:
"composer": true
Reports
Configure output formats and locations.
HTML Report
"reports": {
    "html": "./build/report/my-project"
}
Generates an interactive HTML dashboard at the specified path.
JSON Report
"reports": {
    "json": "./build/json-report/my-project.json"
}
Exports full analysis results as JSON.
Git JSON Report
"reports": {
    "json-git": "./build/json-report/my-project-git.json"
}
Exports only git analysis as JSON.
CLI Report
"reports": {
    "cli": "."
}
Prints a color-coded summary directly to the terminal, including:
- Overview with stacked bar charts for all metrics
- Top offenders (worst files and functions)
- Coupling metrics and instability
- Code smells summary
- Git metrics (if enabled)
- Dependency status (if enabled)
The value is any string to signal that it is enabled, the output goes to stdout.
GitLab Code Quality Report
"reports": {
    "gl-codequality-report": "./build/gl-codequality.json"
}
Generates a JSON report compatible with GitLab’s Code Quality feature. Issues are displayed in merge request diffs.
Multiple Reports
"reports": {
    "html": "./build/report/my-project",
    "json": "./build/json-report/my-project.json",
    "json-git": "./build/json-report/my-project-git.json",
    "csv": "./build/csv-report/my-project.csv",
    "cli": ".",
    "gl-codequality-report": "./build/gl-codequality.json"
}
HTML Project Index
When analyzing multiple projects, generate a central overview page:
{
    "configs": { /* multiple project configs */ },
    "html_index": "./build/project-index/index.html"
}
The index page provides an overview of all analyzed projects at a glance:
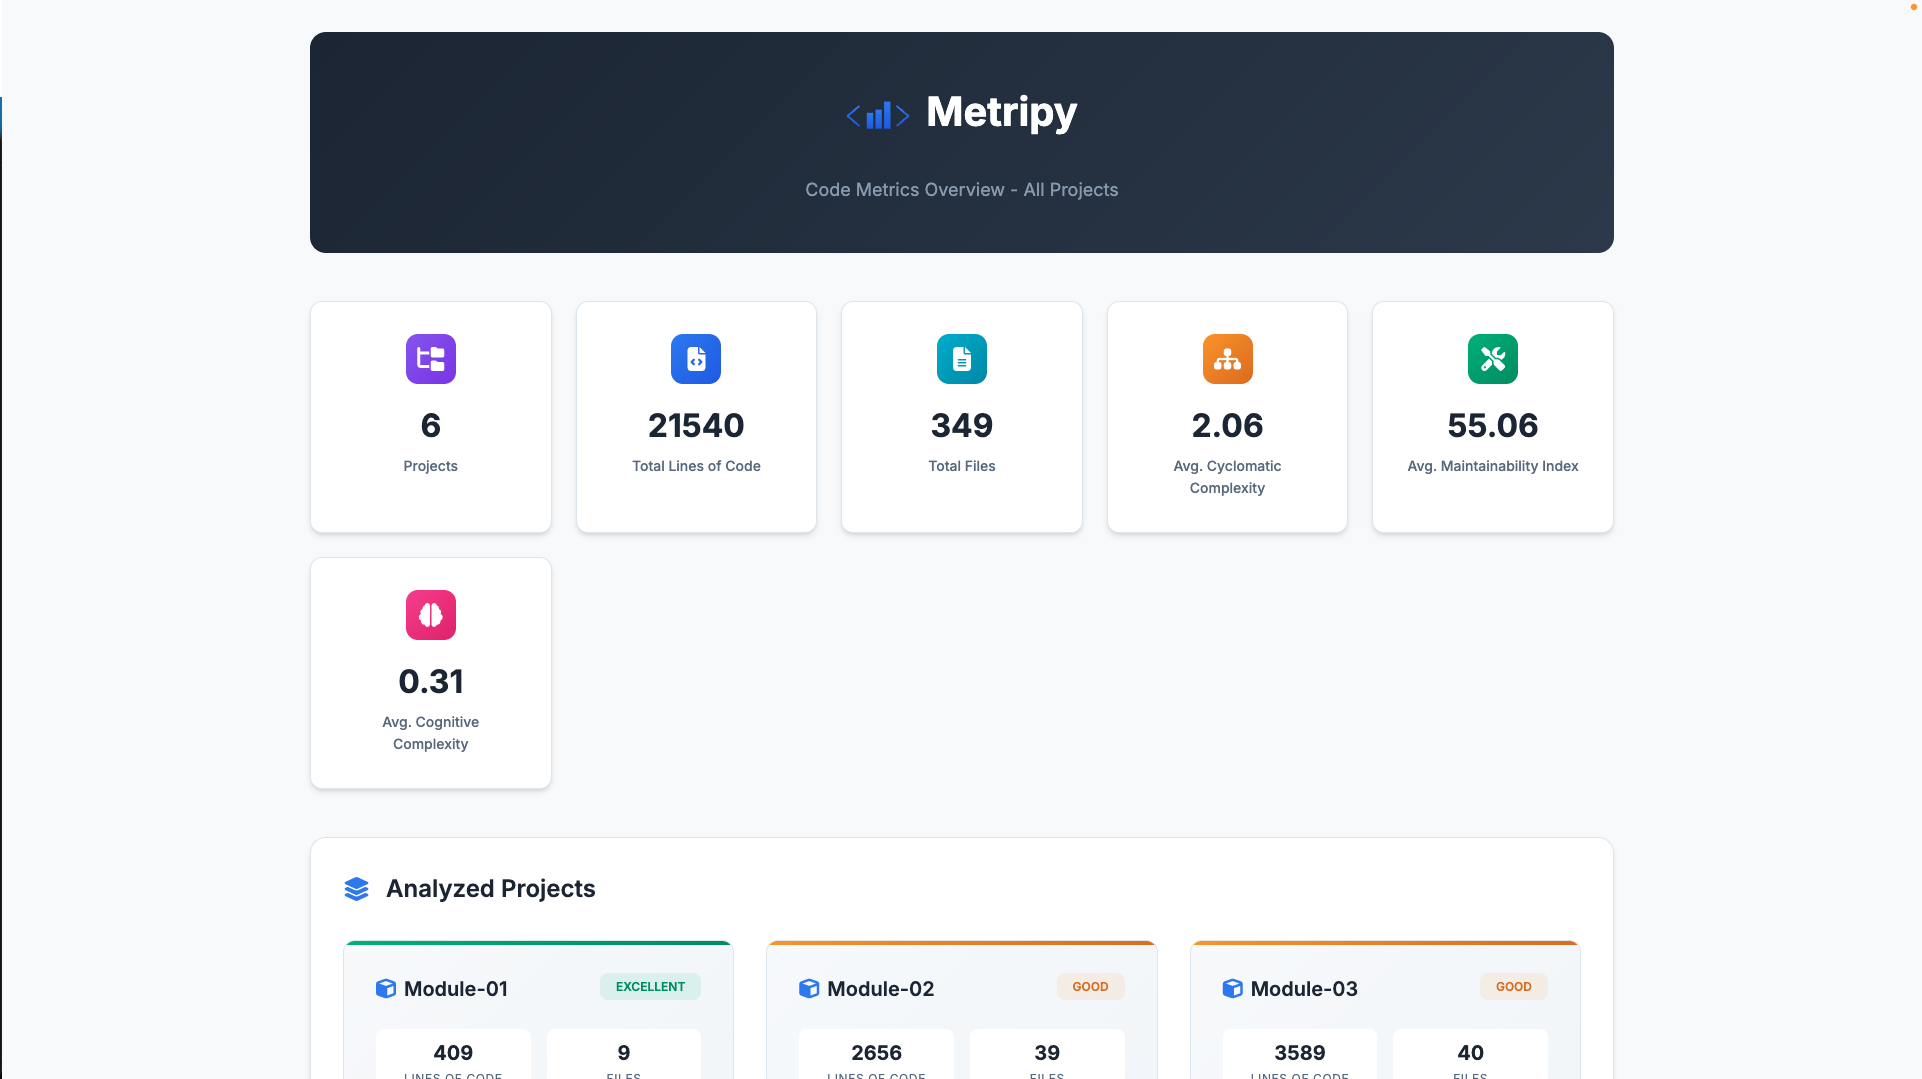
Features:
- Aggregate statistics: Total LOC, files, average complexity, maintainability index, and cognitive complexity across all projects
- Project cards: Each project displays its metrics with a health status badge
- Navigation: Click any project card to view its detailed HTML report
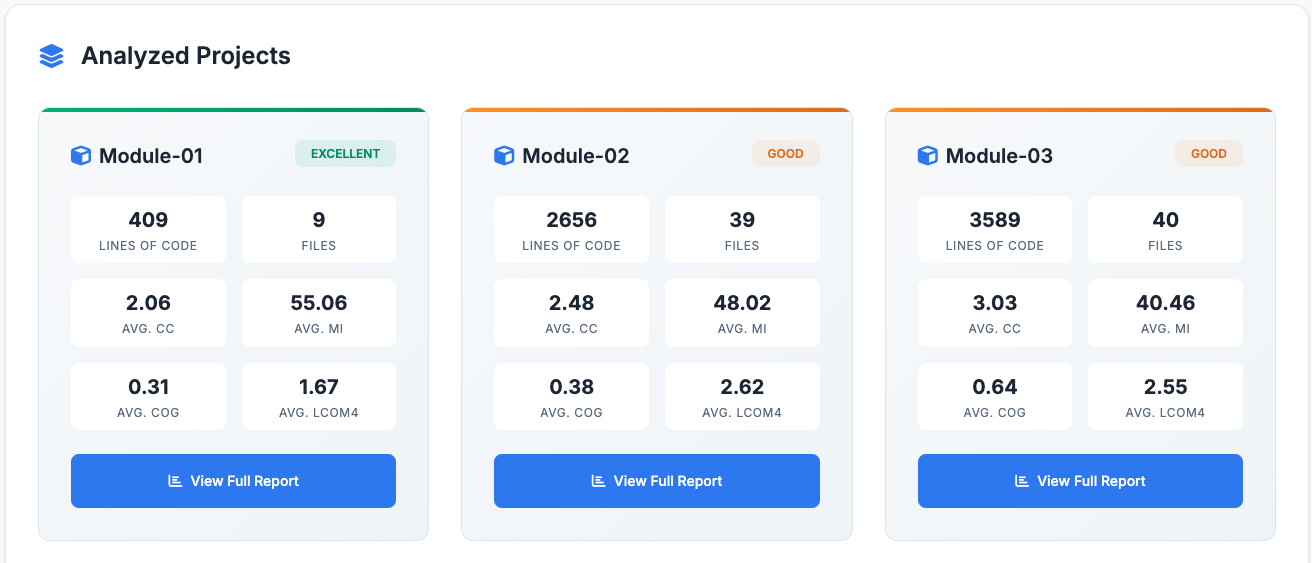
Health Status Calculation:
Health status is calculated using a weighted composite score:
- Maintainability Index (40%)
- Cyclomatic Complexity (25%)
- Cognitive Complexity (25%)
- LCOM4 (10%)
The resulting score maps to: excellent (≥80), good (≥60), fair (≥40), poor (<40).
Note: The html_index option is defined at the root level, not inside individual project configs.
Trend Tracking
Enable historical tracking to see trends over time:
"trends": "./build/historical-json-report/my-project.json"
Metripy will:
- Read previous analysis from this file
- Compare with current analysis
- Calculate deltas and trends
Complete Example
{
    "configs": {
        "metripy": {
            "base_path": "./",
            "includes": [
                "metripy/"
            ],
            "excludes": [
                "__pycache__",
                "*.pyc",
                ".git",
                ".venv",
                "build/"
            ],
            "extensions": [
                "py"
            ],
            "pip": true,
            "git": {
                "branch": "main"
            },
            "reports": {
                "html": "./build/report/metripy",
                "json": "./build/json-report/metripy.json",
                "json-git": "./build/json-report/metripy-git.json"
            },
            "trends": "./build/historical-json-report/metripy.json"
        }
    }
}
Multi-Project Configuration
Analyze multiple projects in one run:
{
    "configs": {
        "backend": {
            "base_path": "./backend",
            "includes": ["src/"],
            "extensions": ["py"],
            "pip": true,
            "git": {"branch": "main"},
            "reports": {
                "html": "./build/report/backend"
            }
        },
        "frontend": {
            "base_path": "./frontend",
            "includes": ["src/"],
            "extensions": ["ts", "tsx"],
            "npm": true,
            "git": {"branch": "main"},
            "reports": {
                "html": "./build/report/frontend"
            }
        },
        "shared-library": {
            "base_path": "./shared",
            "includes": ["lib/"],
            "extensions": ["py"],
            "reports": {
                "html": "./build/report/shared"
            }
        }
    },
    "html_index": "./build/report/index.html"
}
The html_index generates a central dashboard linking to all project reports with aggregate statistics.
Git-Only Configuration
Analyze only Git history (no code metrics):
{
    "configs": {
        "project-git": {
            "base_path": "./",
            "git": {
                "branch": "main"
            },
            "reports": {
                "json-git": "./build/json-report/project-git.json"
            }
        }
    }
}
Command-Line Arguments
Config File
metripy --config=path/to/config.json
Inline Arguments
You can override config file settings via command line, or omit a config file and define the full config via only arguments:
# Set project-specific values
metripy --configs.myproject.base_path="./src" --configs.myproject.extensions="py"

# Set boolean flags
metripy --quiet     # Suppress output
metripy --debug     # Enable debug logging
metripy --version   # Show version
metripy --help      # Show help
Note: Use dot notation for nested properties:
--configs.PROJECT_NAME.PROPERTY=VALUE
--configs.PROJECT_NAME.git="develop"
--configs.PROJECT_NAME.reports.html="./output"
--configs.PROJECT_NAME.trends="./path_to_old_config.json"
The config file contains has pip anaylsis enabled, but for your run you wish to disable it, use:
--configs.PROJECT_NAME.pip=false
It does not have pip analysis enabled, but for your run you wish to enable it:
--configs.PROJECT_NAME.pip
--configs.PROJECT_NAME.pip=true
To add a value to the list properties (includes, excludes, extension) just use PROPERTY=VALUE:
--configs.PROJECT_NAME.includes="some directory"
To empty a list property just use PROPERTY=””. Afterwards you can add new values with the above:
--configs.PROJECT_NAME.includes=""
Global Flags
| Flag | Description |
|---|---|
--quiet |
Suppress non-error output |
--debug |
Enable debug logging |
--version |
Display version and exit |
--help |
Show help message and exit |
Exit Conditions (Quality Gates)
Define conditions that cause the analysis to exit with specific exit codes when thresholds are exceeded. This is essential for CI/CD integration to fail builds when code quality degrades.
Basic Structure
{
    "configs": { /* project configs */ },
    "failure": {
        "EXIT_CODE": [
            {
                "value": "METRIC_NAME",
                "severity": "SEVERITY_LEVEL",
                "amount": THRESHOLD
            }
        ]
    }
}
The failure configuration is defined at the root level alongside configs.
How It Works
- Metripy counts how many files/classes/functions fall into each severity category for each metric
- For each failure condition, it checks if the count meets or exceeds the threshold
- All conditions are evaluated and reported before exiting
- The highest applicable exit code is returned
Available Metrics
File-Level Metrics
| Metric | Description |
|---|---|
file_loc |
Lines of code per file |
file_cyclomatic_complexity |
Average cyclomatic complexity per file |
file_maintainability_index |
Maintainability index per file |
file_cognitive_complexity |
Average cognitive complexity per file |
Class-Level Metrics
| Metric | Description |
|---|---|
class_loc |
Lines of code per class |
class_cyclomatic_complexity |
Total cyclomatic complexity per class |
class_lcom4 |
Lack of Cohesion of Methods (LCOM4) per class |
Function-Level Metrics
| Metric | Description |
|---|---|
function_loc |
Lines of code per function |
function_cyclomatic_complexity |
Cyclomatic complexity per function |
function_maintainability_index |
Maintainability index per function |
function_cognitive_complexity |
Cognitive complexity per function |
Severity Levels
| Severity | Description |
|---|---|
good |
Excellent quality, no issues |
ok |
Acceptable quality |
warning |
Needs attention |
critical |
Requires immediate action |
Examples
Fail on Critical Functions
Exit with code 1 if there are any functions with critical complexity:
{
    "failure": {
        "1": [
            {
                "value": "function_cyclomatic_complexity",
                "severity": "critical",
                "amount": 1
            }
        ]
    }
}
Multiple Conditions per Exit Code
Exit with code 1 if there are too many complex functions OR large functions:
{
    "failure": {
        "1": [
            {
                "value": "function_cyclomatic_complexity",
                "severity": "critical",
                "amount": 5
            },
            {
                "value": "function_loc",
                "severity": "critical",
                "amount": 3
            }
        ]
    }
}
Different Exit Codes for Different Severities
Use different exit codes for different severity levels:
{
    "failure": {
        "1": [
            {
                "value": "function_cyclomatic_complexity",
                "severity": "warning",
                "amount": 20
            }
        ],
        "2": [
            {
                "value": "function_cyclomatic_complexity",
                "severity": "critical",
                "amount": 5
            }
        ]
    }
}
If both conditions are met, the highest exit code (2) is returned.
Complete CI/CD Example
{
    "configs": {
        "my-project": {
            "base_path": "./",
            "includes": ["src/"],
            "extensions": ["py"],
            "reports": {
                "html": "./build/report",
                "gl-codequality-report": "./build/gl-codequality.json"
            }
        }
    },
    "failure": {
        "1": [
            {
                "value": "function_cyclomatic_complexity",
                "severity": "critical",
                "amount": 1
            },
            {
                "value": "function_maintainability_index",
                "severity": "critical",
                "amount": 1
            },
            {
                "value": "class_lcom4",
                "severity": "critical",
                "amount": 5
            }
        ]
    }
}
CI/CD Integration
GitLab CI
code-quality:
  stage: test
  script:
    - pip install metripy
    - metripy --config=metripy.json
  artifacts:
    reports:
      codequality: build/gl-codequality.json
  allow_failure:
    exit_codes:
      - 1  # Allow exit code 1 as warning
GitHub Actions
- name: Code Quality Check
  run: |
    pip install metripy
    metripy --config=metripy.json
  continue-on-error: false
Best Practices
1. Exclude Test Files
If you don’t want to analyze tests:
"excludes": [
    "tests/",
    "test_*.py",
    "*_test.py"
]
2. Multiple Configs for Different Purposes
Create different config files for different use cases:
metripy.full.json      # Full analysis with Git and dependencies
metripy.quick.json     # Code metrics only
metripy.git.json       # Git analysis only
3. Use Relative Paths
Use relative paths for portability:
"base_path": "./",
"reports": {
    "html": "./build/report"
}
4. Document Your Config
Add a README section explaining your config:
## Running Code Metrics

```bash
metripy --config=metripy.json
Reports are generated in ./build/report/
## Troubleshooting

### Config Not Found

Ensure the path to config file is correct:

```bash
# Use absolute path
metripy --config=/full/path/to/metripy.json

# Or relative to current directory
metripy --config=./config/metripy.json
Invalid JSON
Validate your JSON using a linter:
# Online: jsonlint.com
# Or use Python
python -m json.tool metripy.json
No Files Found
Check your includes, excludes, and extensions:
"includes": ["src/"],        // Does this path exist?
"excludes": ["src/"],        // Are you excluding what you included?
"extensions": ["py"]         // Does this match your files?
Git Branch Not Found
Ensure the specified branch exists:
git branch -a | grep main
Or use your default branch:
"git": {
    "branch": "master"  // or "develop", etc.
}
| View Features → | Getting Started → |